*When you have quant data, you often use tables and graphs for representing your data.
*Apparently "The Visual Display of Quantitative Information" by Edward Tufte is a really good resource. It can be ordered for around $40 from the website: htttp://www.edwardtufte.com/tufte/
*"Visualizing Data" by William Cleveland is said to be another good source.
*And then there is: Trout in the Milk and Other Visual Adventures by Howard Wainer. Here is an indication of the type of things he has to say:
http://www-personal.engin.umich.edu/~jpboyd/sciviz_1_graphbadly.pdf
*****************************************
*Rasch Analysis might be useful to use when analyzing test scores.
From http://www.rasch-analysis.com/using-rasch-analysis.htm
a Rasch analysis should be undertaken by any researcher who wishes to use the total score on a test or questionnaire to summarize each person. There is an important contrast here between the Rasch model and Traditional or Classical Test Theory, which also uses the total score to characterize each person. In Traditional Test Theory the total score is simply asserted as the relevant statistic; in the Rasch model, it follows mathematically from the requirement of invariance of comparisons among persons and items.
A Rasch analysis provides evidence of anomalies with respect to
the operation of any particular item which may over or under discriminate
two or more groups in which any item might show differential item functioning (DIF) anomalies with respect to the ordering of the categories. If the anomalies do not threaten the validity of the Rasch model or the measurement of the construct, then people can be located on the same linear scale as the items the locations of the items on the continuum permits a better understanding of the variable at different parts of the scale locating persons on the same scale provides a better understanding of the performance of persons in relation to the items. The aim of a Rasch analysis is analogous to helping construct a ruler, but with the data of a test or questionnaire.
More info at:
http://www.rasch.org/rmt/rmt94k.htm
http://www.rasch.org/rmt/rmt94k.htm
http://www.winsteps.com/
*****************************************
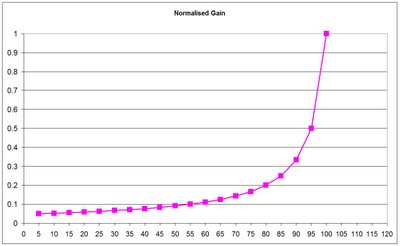
* When we compare pre- and post scores, we usually make the faulty assumption that the gain is measured on a unidimensional scale with equal intervals. In fact, you have to normalise your scores first. A gain from 45 to 50% (5 points) is not the same as a gain from 95 to 100% (also five points) The following formula can be used: g = [{%post} – {%pre}] / [100% - {%pre}]
Where:
The brackets {. . .} indicate individuals averages,
g is the actual(normalized)average gain
So if a person improved from 45% to 50% his gain would be:
{g} = (50 – 45)/ (100 – 45) = 5/55 = 0.091 (On a scale from 0 to 1).
This means the person learnt 9.1% of what he didn’t know on the pre-assessment by the time he was assessed again.
If a person improved from 95% to 100% his gain would be:
{g} = (100 – 95) / (100 – 95) = 5/5 = 1 (On a scale from 0 to 1). This means the person learnt 100% of what he didn’t know on the pre-assessment by the time he was assessed again. (The graph at the bottom demonstrates the logistic curve of this formula)
This formula should only be used if:
(a) the test is valid and consistently reliable;
(b) the correlation of {g} with {%pre} (for analysis of many courses), or of single student g with single student %pre (for analysis of a single course), is relatively low; and
(c) the test is such that its maximum score imposes a performance ceiling effect (PCE) rather than an instrumental ceiling effect (ICE).
No comments:
Post a Comment